
Two professors from Ohio Wesleyan University gave a virtual lesson Wednesday in how the novel coronavirus pandemic is being measured.
It turns out that data can be used to model, or forecast, the impact of the outbreak and how to limit that impact.
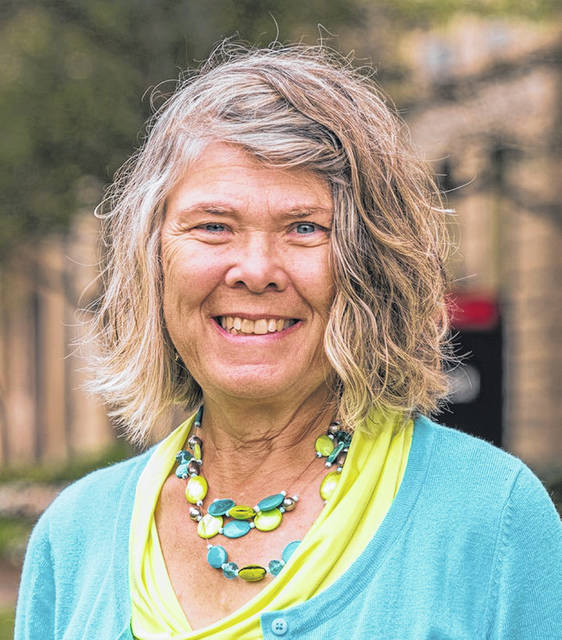
Physics professor Barbara Anderek said the Imperial College of London modeled COVID-19 and predicted that if nothing was done, 2.2 million people would die from the infectious disease in the United States. Other models, including MIT, Northeastern and Columbia, varied and were not as pessimistic. “It’s very challenging to figure out where we go from here,” she said.
Anderek showed some graphs for our own state, and said, “Predictions from models as to where are we going to go from here vary widely for Ohio because it came right after the outbreak at the Marion Correctional Facility.”
Modeling disease spread requires appropriate model, as tested with historical data, reliable inputs (data), recognition of assumptions, consideration of local conditions and interventions, and changes as circumstances change.
“Smaller case numbers make it harder to extrapolate numbers for predictions,” Anderek said.
A mathematical formula can be derived to determine the basic reproductive ratio, represented as R naught. It can be estimated by S x beta x L, where S is the number of susceptible individual encountered per day, beta is the transmission probability per encounter, and L is the infectious period in days. This can be graphed to show the bell curve (as in the term flattening the curve); or the cumulative death rate, which is more of an S-shaped curve. Both graphs have inflection points, that is, where the tide turns.
If the R naught value is 2 or greater, you’ll have an epidemic. If it is less than 1, the disease will die out. It has been shown that the R value can be brought down by lowering the S value with self-isolation, social distancing, school closures, and lockdowns. The R value can also be brought down by lowering the beta value hygiene and personal protective equipment.
Anderek said possible pandemic wave scenarios for COVID-19 have shown three types of graphs: peaks and valleys, a fall peak, or a slow burn.
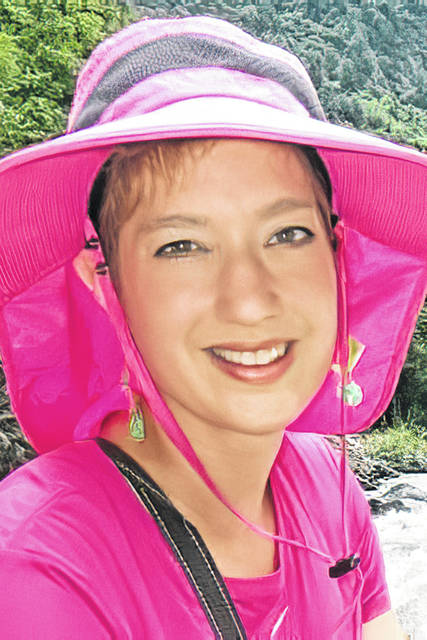
Professor of Biology Heather Fair said she was supposed to teach in China next month, but she was told in February it was canceled. Through her overseas travels, she had a collection of masks, which she began using when she started venturing out.
Fair discussed two types of modeling for the spread of a disease. One is called SIR, which stands for susceptible, infectious and recovered.
“The assumptions are everyone is susceptible, there is a closed population size (not counting births or deaths), constant rates, well-mixed population, and the recovered group is immune,” Fair said. The SEIR model adds the variable of being exposed. “These models can get very complex,” she said. Some models can be deterministic using differential equations, or stochastic, using a random framework.
She showed SIR models plotted out for 85 and 35 days for different cities. She said the graphs showed that “population density makes it spread faster. Social distancing really has an impact. Modified behavior (hygiene and PPE) cuts transmission rate in half.”
Vaccinations are also important, she said, pointing out that it has eradicated smallpox, and minimized measles. “Herd immunity is when enough people are immune, it protects the entire population. The goal is to reduce R.”
Fair had three of her students talk about the novel coronavirus in other countries.
It was explained that in South Korea prior to the pandemic, one-fifth of the adults said they wore a mask out whenever they were feeling sick just to prevent anyone else from getting sick, which many in the United States don’t understand. While there were measures that to us seemed like invasions of privacy, such as visitors being required to self-quarantine, South Korea appeared to be doing better than many other countries.
On the other hand, the students discussed how Brazil’s president has downplayed the disease, even though its cases have exceeded the country of origin, China. Add to that poverty, unhygienic conditions, slow response and deforestation of the rain forest, and cases could continue to rise.
“If I had double the number of students, we would have studied double the number of countries,” Fair said after the student presentations.
The Wednesday panel discussion concluded week two of a 10-week, free online course called “We’re in This Together: An Interdisciplinary Exploration of the Coronavirus Pandemic.” The course is open to students and public alike.
For more information about Ohio Wesleyan’s “We’re in This Together” course, visit www.owu.edu/COVIDclass.


