
After receiving final results of the state’s 2014-15 report card, three of the county’s school districts are downplaying the value of the data while the other is crowing over its results.
Although Big Walnut, Buckeye Valley and Delaware City all received some A’s, each also had at least one F grade. However, Olentangy’s lowest grade was a C amid mostly A’s. Olentangy received the best scores in central Ohio.
Part 1 of the report card was released on Jan. 14. Measured were: K-3 literacy (whether students learning to read through third grade — not all districts needed measuring); “Prepared for Success” (whether graduates are ready for college or a career), and graduation rate. Part 2 of the report card was released on Thursday. Measured were: Achievement (on state tests); value-added progress (for students in math and reading in grades 4-8); and “Gap Closing” (whether all students are succeeding).
Component grades, which gives a single grade for items like achievement and progress, will be issued in 2016; and overall district grades will be issued in 2018.
Another component for each district, financial data (including how much is spent on each student), was not given a grade. Olentangy said it spends $9,699 per student, compared to the state average of $10,912.
Here is a summary of how the districts fared:
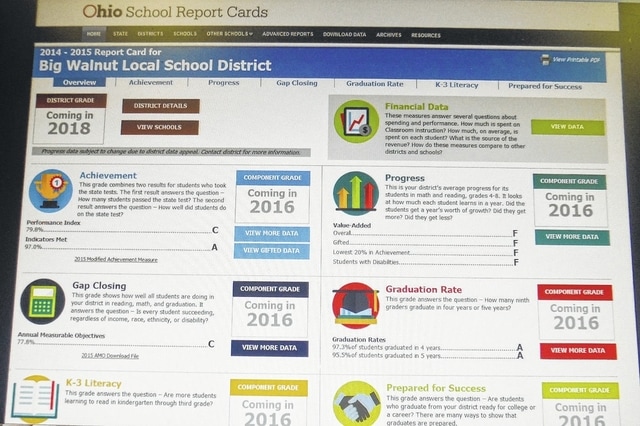
Big Walnut Local Schools
Achievement — Performance Index: 79.8 percent, or a C grade; Indicators Met: 97 percent, A
Gap Closing – Annual Measurable Objectives: 77.8 percent, C
K-3 Literacy Improvement: 49 percent, C
Value-added progress: Overall, F; Gifted, F; Lowest 20 percent in achievement, F; Students with disabilities, F
Graduation rate: 97.3 percent of students graduated in four years, A; 95.5 percent of students graduated in 5 years, A
The Sunbury News reported on Thursday that director of academic achievement Jen Young said the data was released nine months after students took the tests.
“Because of this extreme time lag, it makes it difficult for us to use the data in a meaningful way to guide instruction,” Young said. “Due to the changes in tests, it will be several years before the state gives us any data that we can compare over time.”
“While we certainly welcome assessment data that helps us guide instruction, we do not feel that the data from the latest report card, which is now being delivered a year after the fact, is very helpful in terms of driving instruction,” Superintendent Angie Pollock told The Gazette. “We also feel that the constant changes in the format have yielded results that are not consistent with what we’ve seen over the last few years. Since we know that we didn’t suddenly get students or teachers, the variable there is the test itself. Frankly, we put very little stock with those scores.”
The value-added and K-3 measures don’t reflect what’s going on in the district, she said.
“We’re actually putting together a quality profile like Olentangy and several other districts do, where we can report some of these other measures, so that we’re not relying on one test from the state that legislators themselves have said is flawed.”
She said she is asking parents to urge their legislators for a fair assessment program that doesn’t detract from instructional time.
Buckeye Valley Local
Achievement — Performance Index, 79.8 percent, C; Indicators Met, 97 percent, A
Gap Closing — Annual Measurable Objectives, 55.6 percent, F
K-3 Literacy, not rated
Value-added progress: Overall, A; Gifted, B; Lowest 20 percent in achievement, C; Students with disabilities, C
Graduation rate: 90.9 percent of students graduated in four years, B; 95.2 percent of students graduated in five years, A
“Overall, I was pleased with how we did at Buckeye Valley. It reaffirms that we’re moving in the right direction,” said Superintendent Andrew Miller. “I was especially excited about the overall value-added grade of an A. Above all else, that helps us to show that our kids are exceeding what would be expected of their growth each year, and that’s a really good thing for our district. We’re going to need to do our homework on the Annual Measurable Objectives. That is a difficult metric.”
Like many educators across the state, he was disappointed the grades were late in being released.
“It’s likely going to be different next year, based on using some new measures again,” Miller said. “It’s a good snapshot of our district. On the flip side, it would be nice to have it earlier so we can try to use it for some of our planning the school year, but that didn’t happen.”
Delaware City Schools
Achievement — Performance Index: 76.5 percent, C; Indicators Met, 78.8 percent, C
Gap Closing — Annual Measurable Objectives, 58.1 percent, F
K-3 Literacy Improvement: 34.3 percent, D
Value-added progress: Overall, F; Gifted, F; Lowest 20 percent in achievement, F; Students with Disabilities, F
Graduation rate, 90.9 percent of students graduated in four years, B; 95.3 percent of students graduated in five years, A
Superintendent Paul Craft said he had “more questions than answers” about the district’s report card.
“There are some real concerns that remain to be addressed, especially in relation to the impact of students switching to taking the tests all online (as we did) versus taking them in the old paper format,” Craft said in an e-mail. “So far it looks like that may make a real difference in achievement scores and value-added.”
In a letter to his staff, Craft said other data shows “our students are growing as expected” despite receiving an F grade in value-added, “after four straight years of A’s … with no major changes in our staff, curriculum or students.”
There were some bright spots, though.
“One thing that is encouraging to me is that in those tested areas that did not undergo major changes, most notably third-grade reading and many of the high school metrics, our scores are at all-time highs,” Craft said. “Similarly, other metrics not influenced by all of the changes in the test regimen, including ACT scores, AP scores, graduation rates and industry credentialing, similarly are at or near all time highs.”
Craft said he hoped the measures would be sorted out in a year or two, and “we will look at the data to glean from it what we can so that we can work to get better at what we do for our students.”
Olentangy Local Schools
Achievement — Performance Index, 88.3 percent, B; Indicators Met, 97 percent, A
Gap Closing — Annual Measurable Objectives, 89.9 percent, B
K-3 Literacy Improvement: 57.8 percent, C
Progress: Overall, A; Gifted, A; Lowest 20 percent in achievement, A; Students with disabilities, A
Graduation rate, 98.5 percent of students graduated in four years, A; 98.4 percent of students graduated in five years, A
The district said it has earned the highest value-added gain index in the state, more than double the next highest district.
“Anyone who has spent time in an Olentangy school knows this district has the winning combination of quality teachers, talented students and supportive families,” said Superintendent Mark T. Raiff in a statement. “This data shows how powerful that combination can be.”
During a school board meeting Thursday, Raiff said: “We are going to celebrate these results. It was a great day for us.”
District administration has said they will use the data, as well as its own measurements. “Our students are getting what they need in the classroom,” said Jeanette Kenney, supervisor of data and assessment.
With all of the changes to the state report card and other areas of education, Olentangy administrators have said the last five years have been the hardest ever for teachers throughout Ohio.
For more information, visit: http://reportcard.education.ohio.gov.

